Excel Assignment Help (Level Up Your Excel Skills with Pro Excel Homework Help Tutors)

Order Now
Why Choose The Statistics Assignment Help?
On Time Delivery
Plagiarism Free Service
24/7 Support
Affordable Pricing
PhD Holder Experts
100% Confidentiality

I have used their services many times and they have never disappointed me so far. They deliver quality output for every assignment I order from them.
It is impossible for me to work on the assignment doing the part time job. My friend gave me a solution in the form of these people. The assignments are of top notch quality and I scored well in the assessment
I took the help of these people to submit Excel assignment when its deadline is nearing. The write-up was extremely well. I secured A grade in the assessment
Struggling with Excel Homework? Our Statistics Experts Are Here to Help!
Do you find it challenging to complete the Excel assignment? Without panicking, you can seek the help of our Excel Assignment Help experts who have years of experience in giving theoretical and practical assistance to students at different academic levels. Our statistics experts ensure they follow your class notes & assignment guidelines to deliver the Excel assignment solution exactly as per your requirements. If the assignment involves writing a technical report based on the data analysis findings, then our statisticians support you with that too. Our Excel Assignment Help experts will work on the assignment and deliver an accurate solution that will help you achieve A+ grades in your statistics coursework.
At The Statistics Assignment Help, offers help in solving statistical problems using Excel. In addition to giving detailed analysis, clear-cut explanation, and showing the output, we also give instructions to use the right commands/formulas for performing data analysis. Our Excel Homework Help experts also have knowledge of various statistical, finance, economics & mathematical concepts which helps them in solving almost every Excel project that comes their way. We are the best website for providing Excel Assignment help.
If you need reliable and affordable Help with Excel Homework, then contact us now to boost your grades and skills.
About Microsoft Excel
Microsoft Excel is a program made by Microsoft that works on Windows computers. It helps you do math and make charts to show your data. It also has a special language called Visual Basic for Applications that lets you create small programs. Various features offered by Excel will be used in different fields like Engineering, Finance, Statistics, and Mathematics. This spreadsheet application comprises of many spreadsheets that one can add per their requirements.
Every sheet has cells with rows and columns and each cell will have a different address with the respective row and column. You can perform various arithmetic operations sum, subtraction, division, etc in the Excel sheet. You can also find logical operators like AND, FALSE, IF, NOT, OR, and IN ERROR to carry out operations. Also, you can find complicated formulas in the Excel sheet to find answers. There are financial functions like FV, IRR, NPV, ACCRINT, etc that one can use in the stock market, chartered accounts, and other fields.
Why do Students Ask for Excel Assignment Help?
Excel is the most useful application to showcase data in the form of tables and graphs. The key features that are offered in Excel include – Pivot Table, Pictures, Shapes, Chip art, Charts, etc. Our Excel Assignment experts will make sure to complete precise data analysis in Excel. With our unique step-by-step approach, we assure you the best in class Excel Homework help.
Excel involves using many formulas & then finding the accurate solution to the given assignment problem. Many students find it challenging to use the formulas to come up with the correct answers and thus end up losing grades. To get excellent grades in statistics coursework, it is important to get the Excel assignment solution right and thus students ask our experts - 'do my Excel assignment' or 'do my Excel homework' and we will get it done within the given deadline.
Advantages of Microsoft Excel for Student Assignments
Here is the list of advantages one can reap using Microsoft Excel & important reasons why students prefer using excel over other statistical tools to Solve Statistics Assignments & Homework.
- Simple and highly effective to do the comparison: Excel is an effective application that is used by statisticians across the globe. This helps you to briskly analyze huge amounts of data. You can use this to find trends and patterns that let you make quick decisions. Graphs and maps are used for visualizing the data. You can even organize the data briskly in this application.
- Review the huge amounts of information in no time: Over time, Microsoft Excel is evolving and is getting better. The most critical feature of excel is to process huge amounts of data in a short time span. Features like filtering and sorting of data are possible through excel. You can also delete the data from excel quickly. Various other features that are offered by excel are pivot tables, and advanced graphs, which make it easier to access the details.
- Collaborative attributes: Excel will let you work with the team on one sheet simultaneously. This is helpful when you are working with hundreds of spreadsheets for your excel project. This helps you to work on a single sheet while your team members are working on the other sheets in the same file online. This feature allows you to have quick access to a lot of data efficiently. There is no need for you to have a configuration of other programs to work on the same excel file by all your team members.
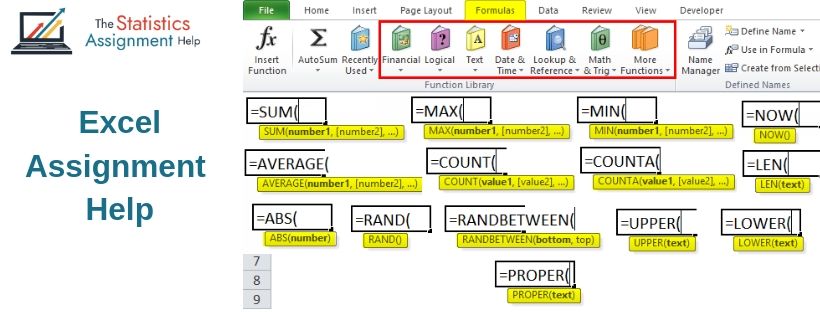
- Functions and formulas: Excel works as a scientific calculator. Using this you can do almost any kind of mathematical calculation. There are simple math functions that you can view in Excel such as average, min-max, and autosum. A few of the powerful features that you can see are vlookup, hlookup, offset, and indirect.
Learn all such advantages of MS Excel by getting in touch with us. We are the most trusted and reliable Excel homework help for all your needs.
Advanced Excel Concepts for Complex Assignments
Excel is a powerful tool for data analysis. It provides a wide range of features and functionalities to help you extract the meaningful information. With Excel expertise, you can improve your workflow. Increase understanding of statistical concepts by improving data accuracy.
Key Excel Concepts for Statistical Analysis:
- Formatting Worksheets: Customizing the appearance of your worksheets can improve readability and visual appeal. Adjust font styles, colors, and alignment to enhance data presentation.
- Editing and Proofreading: Ensure data accuracy by carefully reviewing and editing your worksheets. Use Excel's spell-checking and autocorrect to reduce mistakes.
- Organize Your Data: Rename, move, copy, and delete sheets as needed to keep your data organize.
- Math and Statistical Formulas: You can also do a lot of calculating and statistics on Excel using the different functions like averaging, median, mode, standard deviation, correlation and regression analysis etc.
- Lookup Information and Text Formulas: Perform data retrieval from other sheets or files by using the different lookup functions such as VLOOKUP, and HLOOKUP. Apply operations on textual data in order to manipulate it and alter its style.
- Worksheet Collaboration and Review: Share a file with other people, control changes and offer comments on the work in order to achieve the goal of high data quality.
- Charts and Graphics: It is recommended to utilize such charts and graphs to make them impressive in regards to the aesthetics in order to successfully convey your conclusion and analysis.
- Data Management: Three of the tasks include arranging your data in a meaningful way, eliminating redundancy and useless information as well as formatting your data with the help of Excel.
- Data Analysis: Use statistical measures to quantify your data, possibly generate patterns and then arrive at reasonable conclusions.
- Macros and VBA: Create macros and functions especially with the help of Visual Basic for Applications which is a programming language of Excel.
Learning these vital skills will prepare you for tackling challenging statistical tasks and gain insight from analyzing different sets of data.
Popular Excel Topics for Excel Assignments
Excel is a powerful tool for data analysis, offering a wide range of features and functions to help you extract valuable insights. Here are some popular topics covered by our Excel Assignment Help:
Core Topics:
- Pivot Tables: A pivot table is an inter-active tabular or data-like representation of the data in a “table” style. Pivot tables are useful in making tables that define relationships, add up totals and clearly show trends as well as patterns.
- Linear Regression: Build predictive models to understand relationships between variables. To predict future values calculate them with the help of a linear regression and learn about the cause and effect of changes.
- Linear Programming (Solver): Linear programming formulation problems that involve optimizing one or several of the resources. Solver assists you in maximizing or limiting a specific target in accordance with certain defined conditions or restrictions.
- Descriptive Statistics: Important numbers that allow a researcher to be armed better in situations of exploration of information by the researcher from the data. Descriptive statistics help understand how information spreads, its main trends, and the extent of its spread.
- VLOOKUP and HLOOKUP: To locate a particular value in a database, these steps can be performed with its associated functionalities. Vlookup looks for data value vertically in the columns while Hlookup looks up a data value horizontally in a row.
Advanced Topics:
- VBA (Visual Basic for Applications): Use VBA to write functions and perform routines in order to speed up procedures. Some usual applications include simplification of repetitive processes and creation of data manipulation structures.
- Macros: Capture and automate routine tasks to save time. Macros can be implemented in order to perform entry tasks or formatting as well as simple calculations, and this would require much of your time.
- INDEX and MATCH Functions: Better and more versatile solutions than VLOOKUP and HLOOKUP for lookup operations with various data. INDEX and MATCH have more features and should be used in case the issues with VLOOKUP and HLOOKUP occur.
- ActiveX Controls: Insert additional controls to your worksheets like buttons, text boxes, and drop-down list boxes. They make the user interaction active and help build interesting worksheets and tools thereon.
- Dashboards: Make KPI taxonomies and develop a method for presenting the necessary data in the form of clear and easy-to-use visualizations, such as dashboards. Dashboards give an organised and summarised presentation of information that is useful in making conclusions.
- Accounting and Financial Analysis: Use of Excel in budgeting, forecasting and in the analysis of the financial statements. To summarize, all Excel financial tools and templates can be considered as a precious assistance for accountants and financial analysts.
- Inferential Statistics: Use inferential statistics to make decisions about populations based on samples. It provides hypothesis testing, confidence intervals, and regression analysis to assist you in its inference and prediction.
| Financial and Economics problem-solving | ODBC and data linking connections |
| Powershell optimization | Optimization Add-in |
| Excel Solver | FRM |
| Pivot tables | Add-in Creation |
| Pearson and MyITLab projects | Macros |
| Mortgage Calculations | Excel VBA optimization |
| Simnet Homework Help | Amortization Tables – ARM |
| Linear Programming Problems | Excel VBA optimization |
| Loan, Mortgage Calculations, Schedules - Amortization Tables - ARM, FRM | Pearson and MyITLab projects |
| Simnet Homework Help | Descriptive Statistics |
| Inferential Statistics | Regression Analysis |
Hire Experts for Professional Excel Assignment Solutions
Excel is an application that many students find complicated to work on and execute the tasks that are given by the professors.
There are different types of labs using which you can work on excel
- MyMathLab: It helps students to master the skill of working on excel and doing mathematics using it. Students can excel by sitting in the comfort of their homes. This digital course will be created based on the needs of students and their curriculum. The course will be highly interactive and the content would be prepared by the experts in excel. These series of courses will help students get hold of excel in no time.
- Pearson Lab: This company takes pride in offering MyLab IT where you can perform online assessments and training on Microsoft applications, especially excel. It helps students to get hold of various functions in excel. Practicing excel exercises in this lab makes them industry ready.
We have helped students and professionals across USA, UK, and Australia to offer the best Excel coursework help.
Why Choose Our Excel Assignment Help?
Struggling with Excel assignments? Our Excel Assignment Help expert team is here to provide personalized guidance and support. Why choose us:
- Expert Guidance: Our team of experienced Excel experts provides personalized support and tailored solutions.
- Comprehensive Coverage: We tackle everything from entry level concepts such as typing data in the cells to more complex exercises for instance using excel to do statistical tests.
- Timely Delivery: We make sure that the assignments completed are delivered on time and within the time required.
- Affordable Pricing: All our services are affordable to ensure that all students gain access to expert assistance.
- Quality Assurance: You are assured of a high quality work that you will be provided with.
Don't let Excel assignments hold you back. If you ever need Help with Excel Homework, Contact us today for expert Excel Assignment Help and achieve your academic goals.
Frequently Asked Questions
There are a few basic procedures to writing an Excel Assignment or Homework:
- Research the subject and be aware of the intricacies.
- Identify any resources that can assist you in working more quickly.
- Take some notes and jot down all of the important details on paper.
- Provide examples to support each concept.
We went through all you need to know about Excel homework, including Understanding Workbooks, Using the Blank Workbook Template, Typing Text, Typing Numbers, Typing Dates, Understanding the Fill Handle, Typing Formulas, Easy Formulas, and more. Our crew is accessible to assist you with any topic relating to Excel Assignment Help 24 hours a day, 7 days a week.
- They will aid you by providing skilled assistance with the necessary information and writing abilities to help you improve your grades.
- Identify any resources that can assist you in working more quickly.
- Completed all of the requirements set forth by your college/university
- Prior to sending the Excel Assignment to you, Plagiarism tools can assist our specialists in detecting plagiarism.
- Our staff never compromises on content quality; it will serve you well for many years.
We will send you the Excel assignment solution to your registered email address or to your student account, ensuring that the assignment dates are met.
In an emergency, our professionals are there to assist you 24 hours a day, seven days a week. Your questions will be answered by the customer support representatives. You will receive your service within the specified time frame.